人工智能与机器人的兴起重塑了全球劳动力市场,也引起了学术界极大的研究热情。其中,经济学界最具代表性的人物无疑是 Daron Acemoglu,其撰写的几篇关于机器人的文章,基本都发表在诸如 AER,JPE,RES 等经济学顶刊上,尤其是 2020 年发表于 JPE 的 《Robots and jobs: Evidence from US labor markets》,短短两年间,引用量就超过了 2400 次。
中文期刊中,也有多篇关于机器人的文章见诸于《管理世界》、《经济研究》等顶级期刊,关于各种话题的研究纷纷涌现。
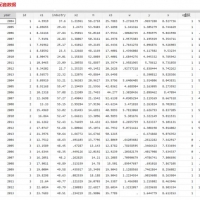
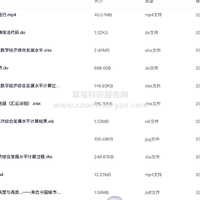
看到这个领域日趋火热,我们参考了王永钦、董雯 2020 年发表于《经济研究》一文的方法,计算了 2011-2019 年中国制造业上市公司的机器人渗透度,以飨读者。该数据为公司层面数据,并保留了公司和年份信息,可与上市公司的其他财务信息匹配,展开自己感兴趣的研究。
我们参考 Acemoglu and Restrepo (2020) 和 王永钦、董雯 (2010) 的做法,构造中国制造业企业层面的机器人渗透度指标。具体测算方法如下:

其大致思路是,先计算出行业层面的单位从业人员的机器人数量 (机器人渗透度),随后再使用标准化的企业生产部门人数占比乘以行业机器人渗透度,两者的乘积即为该企业的机器人渗透度。
在计算过程中,我们需要解决几个核心问题,下面我们具体展开分析。
首先,我们要完成不同版本行业分类代码的衔接。这其中由分为两个部分,分别是《2002 版国民经济行业分类与代码》和《2011 版国民经济行业分类与代码》的衔接,以及中国的行业分类代码与 IFR 行业分类代码的衔接。参考王永钦、董雯 (2020) 的做法,我们先将中国的二位数制造业行业分类码统一至 2011 年,随后再与 IFR 进行匹配。
调整后的行业分类为:

随后我们开始用Stata实现具体计算:
先确定工作路径:
- cd "~/Desktop/IFR to firm"
- global path "~/Desktop/IFR to firm"
- global raw_data "$path/raw_data"
- global result_data "$path/result_data"
参考王永钦、董雯 (2020) 的测算方法,我们先计算出 2010 年中国各行业的从业人数。该数据来自于 CSMAR。
- import excel using "$raw_data/IND_Indstsvy.xlsx", firstrow clear
- labone, nrow(1 2)
- drop in 1/2
- keep Yeasgn Indcd Indnme Noemploy
- destring Yeasgn Indcd Noemploy, replace force
- keep if Yeasgn == 2010
- keep if inrange(Indcd, 13, 43)
- #delimit ;
- recode Indcd (13 14 15 16 = 1 "食品与饮料")
- (17 18 19 = 2 "纺织与服装")
- (20 21 = 3 "木材家具")
- (22 23 = 4 "造纸印刷")
- (24 42 43 = 5 "其他制造业")
- (25/30 = 6 "塑料和化学制品")
- (31 = 7 "玻璃、陶瓷、矿石制品")
- (32 33 = 8 "基本金属")
- (34 = 9 "金属制品")
- (35 36 = 10 "机械设备制造")
- (37 = 11 "汽车制造业和其他交通设备制造业")
- (39/41 = 12 "电力设备与计算机、电子产品、光学产品制造"),
- gen(industrycode);
- #delimit cr
- collapse (sum)labor = Noemploy, by(industrycode)
- save "$result_data/labor.dta", replace
- use "$raw_data/IFR.dta", clear
- keep if country == "CN"
- keep if inrange(year, 2011, .)
- drop country Country installations
- gen industrycode = .
- replace industrycode = 1 if industry == "10-12"
- replace industrycode = 2 if industry == "13-15"
- replace industrycode = 3 if industry == "16"
- replace industrycode = 4 if industry == "17-18"
- replace industrycode = 5 if industry == "91"
- replace industrycode = 6 if industry == "19-22"
- replace industrycode = 7 if industry == "23"
- replace industrycode = 8 if industry == "24"
- replace industrycode = 9 if industry == "25"
- replace industrycode = 10 if industry == "28"
- replace industrycode = 11 if industry == "29" | industry == "30"
- replace industrycode = 12 if industry == "26-27"
- keep if !mi(industrycode)
- collapse (sum)stock = operation, by(industrycode year)
- save "$result_data/robot.dta", replace
- use "$result_data/robot.dta", clear
- merge m:1 industrycode using "$result_data/labor.dta", ///
- keep(1 3) nogen
- gen density = stock / labor * 10000
- xtset industrycode year
- save "$result_data/robot_density.dta", replace
- import excel using "$raw_data/员工构成-2011年.xlsx", clear
- labone, nrow(1/2)
- drop in 1/2
- keep A B C R
- replace A = subinstr(A, ".SZ", "", .)
- replace A = subinstr(A, ".SH", "", .)
- destring A R, replace force
- gen year = real(substr(C, -4, .))
- drop C
- xtset A year
- rename (_all)(Stkcd ShortName product_share year)
- order Stkcd year
- drop if mi(Stkcd)
- format Stkcd %06.0f
- save "$result_data/employee_structure.dta", replace
- import excel using "$raw_data/STK_LISTEDCOINFOANL.xlsx", firstrow clear
- labone, nrow(1 2)
- drop in 1/2
- gen year = real(substr(EndDate, 1, 4))
- gen listyear = real(substr(LIST, 1, 4))
- keep if ustrregexm(IndustryCode, "C")
- keep if inrange(year, 2011, 2019)
- clonevar Industrycode = IndustryCode
- replace Industrycode = subinstr(Industrycode, "C", "", .)
- destring Symbol Industrycode, replace force
- #delimit ;
- recode Industrycode
- (13 14 15 16 = 1 "食品与饮料")
- (17 18 19 = 2 "纺织与服装")
- (20 21 = 3 "木材家具")
- (22 23 = 4 "造纸印刷")
- (24 41 42 = 5 "其他制造业")
- (25/29 = 6 "塑料和化学制品")
- (30 = 7 "玻璃、陶瓷、矿石制品")
- (31 32 = 8 "基本金属")
- (33 = 9 "金属制品")
- (34 35 = 10 "机械设备制造")
- (36 37 43 = 11 "汽车制造业和其他交通设备制造业")
- (38/40 = 12 "电力设备与计算机、电子产品、光学产品制造"),
- gen(industrycode);
- #delimit cr
- drop ListedCoID EndDate LISTINGDATE IndustryName
- rename Symbol Stkcd
- format Stkcd %06.0f
- order Stkcd year listyear
- save "$result_data/industrycode.dta", replace
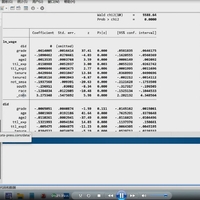
接下来,就是最终的计算结果了。我们先把前述所有数据 merge 到一起,包括 2011 年企业生产部门员工占比,和各行业的机器人渗透度。
随后,我们使用 egen 中的 mediam 计算出生产部门员工占比的中位数。
最后,将企业生产部门员工占比除以中位数,再乘以行业机器人渗透度 density,所得的 exposure 就是企业的机器人渗透度了。
- use "$result_data/industrycode.dta", clear
- merge m:1 Stkcd using "$result_data/employee_structure.dta", ///
- keepusing(product_share) keep(1 3) nogen
- merge m:1 industrycode year using "$result_data/robot_density.dta", ///
- keepusing(density) keep(1 3) nogen
- format %20.0g industrycode
- egen share_median = median(product_share)
- gen exposure = (product_share / share_median) * density
- label var density "行业层面机器人渗透度(每万人)"
- label var product_share "生产部门员工占比"
- label var share_median "生产部门员工占比中位数"
- label var exposure "企业机器人渗透度"
- order Stkcd year
- xtset Stkcd year
- save "$result_data/exposure.dta", replace
|


 窥视卡
窥视卡 雷达卡
雷达卡 发表于 2022-8-4 08:24:40

 提升卡
提升卡 置顶卡
置顶卡 沉默卡
沉默卡 喧嚣卡
喧嚣卡 变色卡
变色卡 千斤顶
千斤顶 照妖镜
照妖镜